


Summary
Full-service and casual restaurants make sense globally, but the cost field changes by country. U.S. street-level rent sits around the mid-$20s/sf/year, Canada’s prime corridors are higher, European/UK high streets can be several times that, and Gulf mall/prime space is also premium. Add higher labor in Europe, energy swings, delivery at 15–30%, and alcohol licensing in some markets — and you must model locally.
Restaurant franchising is what people choose when they want a higher check, more occasions, and a brand that is “seen” in the market — lunches, business meets, family weekends, date nights, tourists. The format ranges from fast-casual with limited seating, through full-service (FSR) with table service, to bar-and-grill concepts with alcohol and late-night peaks. What the franchise gives is a tested menu, operating manuals, supplier programs, training, and brand marketing. What the operator has to bring is a location that matches the daypart and the ability to run staff every day.
The thing that changes across countries is not the restaurant logic — it’s the cost of doing it there.
Regional cost picture
United States. Typical retail/restaurant space is in the mid-$20s per sq ft per year. Strong lifestyle centers, tourist zones, airports and top suburban corridors can be two to three times that. FOH staff often earn in the mid-teens per hour, cooks closer to the high teens, and managers around the mid-$60k/year band. Sales tax on prepared food is added on top. Power can be cheap in some states and expensive in others, which matters for hooded kitchens and HVAC.
Canada. Major cities price restaurant space above the U.S. baseline once converted. Labor is comparable, utilities are predictable, but some equipment and food items are a bit more expensive. For a full-service restaurant franchise this usually means you operate near the upper end of the investment range.
Europe / UK. Prime urban and high-street sites (London, Paris, Milan, Amsterdam, Berlin centers) can be several times more expensive than neighborhood locations. Labor is more regulated, social charges are higher, and delivery platforms work on roughly the same 15–30% commission logic. Because of that, European restaurant units usually pay closer attention to seat turns, lunch offers, and delivery packaging.
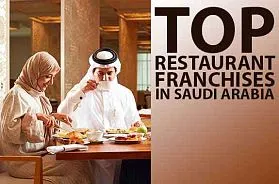
Gulf / Middle East. Visible malls, waterfront and tourism-heavy space are premium, and on top of rent there can be service charges, strict fit-out standards and staff-related costs. Energy can be fine, but the real monthly bill is “rent + service + people,” so the P&L has to be run on local numbers, not on a U.S. example.
Investment and Fees
| Format / Model | Initial investment (range) | Franchise fee (range) | Ongoing fees (royalty / marketing) |
|---|---|---|---|
| Fast-casual restaurant (counter + seating) | $500,000 – $1,300,000 | $25,000 – $50,000 | 4–6% / 1–3% |
| Full-service (table service) | $900,000 – $2,200,000 | $30,000 – $60,000 | 4–6% / 1–3% |
| Bar & grill / restaurant with alcohol | $1,200,000 – $3,000,000 | $30,000 – $60,000 | 4–6% / 2–4% |
| Delivery-first / small take-out restaurant | $150,000 – $450,000 | $10,000 – $30,000 | 4–6% / 0–2% |
These are global working ranges — local building codes, hood/grease-trap rules, landlord requirements, import duties on equipment, and alcohol licensing can push a project to the top of the range.
Cost overlay by region
| Cost driver | United States | Canada | Europe / UK | Gulf |
|---|---|---|---|---|
| Rent | mid-$20s/sf/yr; prime 2–3× | similar or higher in major cities | high streets often several times suburban | premium mall/street + service charges |
| Labor | FOH/BOH mostly mid-teens $/hr; managers ≈$65k/yr | comparable when converted | higher floors + social charges | lower hourly but extra staff/visa/housing costs |
| Power | wide spread by state | predictable | can be higher in some markets | depends on tariff/landlord |
| Delivery | 15–30% | 15–30% | 15–30% | 15–30% |
| Alcohol license | modest in many U.S. states; high in quota states | provincial rules | city/country specific, often slower | varies by emirate/country |
Startup and operating costs
Startup typically includes: leasehold improvements, full kitchen line (hood, ventilation, cooking equipment, refrigeration, dish), dining room furniture and décor, bar equipment if alcohol is served, POS/KDS, signage, opening inventory, staff training and an operating buffer.
Ongoing costs include:
- franchise royalty and brand marketing;
- labor for front- and back-of-house, plus salaried management;
- food and beverage (watch meat, dairy, produce and, if bar, beverage cost);
- occupancy (rent, CAM, insurance, local business taxes, service charges);
- utilities (kitchen + HVAC);
- delivery/app commissions if the concept accepts delivery orders;
- licenses and renewals (health, fire, alcohol where relevant).
Because restaurants run longer hours and have bigger rooms than QSR, the three numbers to protect are food cost %, labor % and occupancy — if two of them go up, the model gets tight very quickly.
Popular global restaurant franchise formats
Fast-casual. Small kitchen, counter ordering, limited service, high throughput. Good for expensive cities and malls.
Full-service. Table service, higher average check, more occasions, more labor. Good for stable urban and tourist areas.
Bar & grill / casual dining. Adds alcohol, sports, events and night traffic; also adds licensing and stricter staff training.
Delivery-first / small dining room. Built to capture delivery and pickup while still having minimal seating for flexibility — useful where rent is high.
Operator profile
Franchisors usually look for: enough capital to complete the build-out at local prices, the ability to recruit and retain staff in that labor market, and discipline with brand standards, hygiene and reporting. Restaurant experience is a big plus, but strong franchisor training can cover a lot if the owner is ready to be present at launch. Multi-unit and multi-country operators should validate four things before signing: rent/service charges, labor floors, utility tariffs and alcohol rules — those are the lines that actually change the P&L.
Testimonials

I am very grateful to the Topfranchise team. Thanks to the platform www.topfranchise.com I sold a Master franchise to Pakistan this year!

So far, we have been pleased and treated as valued customers providing discounts to advertising packages in the English and the Russian version of the company.
We move forward into 2022, with the assurance of having TopFranchise as a valued advertising
partner in expanding the Mikel Brand even further.

A few years ago we decided to start the global expansion, so we started looking for ways how to find our new franchisees. Last year we noticed the Topfranchise.com marketplace.
Since the time we got listed here, our Franchise pitch has been visited by thousands of people, and a couple of hundreds had left their requests. I would like to share a success story. We received the lead from Topfranchise.com. It was a potential franchisee from the USA, who was interested in becoming a part of our company. Today he operates as our Franchisee in Grove town, USA.
At Topfranchise.com we have a manager, who keeps track of our success. If something goes wrong, we can be sure to receive advice. For the extra advertisement, we used newsletters and banners, which helped to attract more potential franchisees.


We express our gratitude to the TopFranchise.com team for their professionalism.
We get a lot of leads performing well as a potential franchisees. We are glad that we have chosen TopFranchise.com as a partner and look forward to further fruitful cooperation.


Cleaning service is now available in Cyprus for houses, apartments and small offices.
Thanks to the Topfranchise team!

After all the preparations and settings, the result came up very soon. Customers do not hesitate to contact us , and we find them reliable. It is wonderful work for Topfranchise.com.

side of our business to the next level. Since then, the results have far exceeded our expectations. With their
ongoing support we’ve successfully expanded to every continent, bringing the remarkable benefits of
Puncturesafe to thousands of motorists worldwide by working closely with some outstanding international
franchise partners.
Having explored many online channels on our journey, I can say with confidence that Topfranchise is the most
reliable online franchising platform in our portfolio, consistently delivering strong, quality leads.
We’re deeply grateful to the team for their dedication and expertise, and we remain very excited about our
partnership and what we’ll achieve together through continued collaboration for years to come.


Topfranchise is so helpful. They help us to find customer from different countries. After we discussed with customers the possible cooperation, we realized that customers from Topfranchise.com have a great potential and strong financials that can help to improve our brand.